Process Discovery
The Process Discovery component is initialised by the GUI when a calculation on a log file has to be performed. It takes as input a list of CSV logs previously recorded and a multiprocessing queue used to communicate with the main process.
Decision points
- class modules.decisionPoints.DecisionPoints(df: DataFrame, status_queue: Queue)[source]
Decision points class
- __generateKeywordsDataframe(dataframe: DataFrame)
Generate keywords dataframe, used in GUI when selecting decision points
- Parameters:
dataframe – pandas dataframe
- Returns:
keywords dataframe with duplicates removed and values sorted
- __init__(df: DataFrame, status_queue: Queue)[source]
Decision points class
- Parameters:
df – pandas dataframe of entire process
status_queue – queue to print values in the GUI
- generateDecisionDataframe() DataFrame[source]
Find decision points in dataframe, ask user which decisions to take and generate final trace built from decisions.
- Returns:
dataframe built from user decisions
Note
The it-h row of a routine trace is considered as duplicated if it includes an event that is exactly the same in the it-h row of all the other routine traces. We evaluate two events as identical if the following data fields have the same value for the event in the it-h row in all the recorded routine traces:
1        self.duplication_subset = ['category', 'application', 'concept:name', 'event_src_path', 'event_dest_path',
2                                   'browser_url_hostname', 'xpath']  # 'tag_value', 'clipboard_content', 'cell_range'
Most frequent routine
Once a log composed by different traces of execution is captured and analysed, the routine that was repeated most often is selected and passed to RPA tool for script creation.
Warning
This method has been deprecated after the introduction of decision points analysis
- modules.mostFrequentRoutine.selectMostFrequentCase(dataframe: DataFrame, status_queue: Queue, flattened=False, threshold=90)[source]
Select the most frequent routine in the process by using levenhstein distance to calculate similarity between strings
- Parameters:
dataframe – low level pandas dataframe of process
status_queue – queue to print messages in GUI
flattened –
threshold – threshold of similarity, traces are considered similar if they are equal by at least 90%
- Returns:
most frequent trace
Deprecated since version 1.2.0: Replaced by decision points
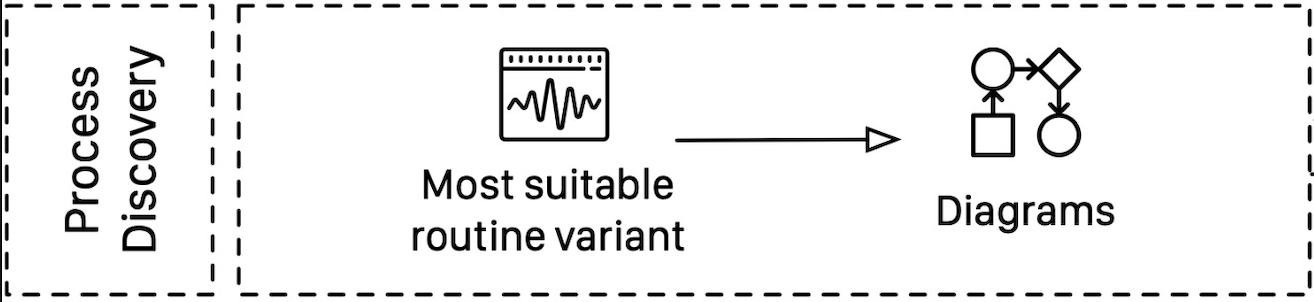
Diagrams
Different high-level diagrams are generated during the analysis of the log file:
Directly-Follows Graphs (DFG) of the entire process model;
Business Process Model and Notation (BPMN) of the most frequent routine;
Petri Net of the most frequent routine.
- class modules.process_mining.ProcessMining(filepath: list, status_queue: Queue, merged=False)[source]
Process Discovery component is initialised by the GUI when a calculation on a log file needs to be performed.
- __init__(filepath: list, status_queue: Queue, merged=False)[source]
- Parameters:
filepath – path of the csv file
status_queue – queue to print messages on GUI
merged – true if class has been called when merging multiple files
- _createDFG(log=None, parameters=None, high_level=False)[source]
create df using dataframe with all traces
- Parameters:
log – low-level event log
parameters – ooptional parameters to generate image
- _createImageParameters(log=None, high_level=False)[source]
Create parameters for diagrams that needs to ben generated. Parameters include source and target nodes as well as file format (diagrams are saved as pdf).
- Parameters:
log – event log
high_level – boolean, if true generate high level diagram
- _create_directories()[source]
Creates directories inside RPA folder where processed files will be saved. Directories include event_log, SW_robot, process_discovery.
- _create_image(gviz, img_name, verbose=False)[source]
Create image file of the generated diagram (DFG,BPMN,Petr net)
- Parameters:
gviz – image file generated by pm4py
img_name – name of the image to be saved
verbose – display log while generating images
- _create_petri_net(remove_duplicates=False)[source]
Generate low level petri net
- Parameters:
remove_duplicates –
- Returns:
petri net
Deprecated since version 1.2.0: Not in use anymore
- _getSourceTargetNodes(log=None, high_level=False)[source]
Identifies the first and the last line in the event log, and mark them as source and target node. Used to color first and last node in the generated diagrams.
- Parameters:
log – low level event log
high_level –
- Returns:
source and target nodes
- class modules.flowchart.Flowchart(df: DataFrame)[source]
Generate high level flowchart diagram (BPMN) from a given trace
- __make_link(a_node, b_node, label=None, width=1, style='dashed')
Make an edge between two nodes
- Parameters:
a_node – first node
b_node – second node
label – label between nodes
width – width of the link
style – link style (dashed or straight)
- Returns:
edge
- __make_node(name, shape=None)
Generate pydot node
- Parameters:
name – name of the node
shape – shape of the node (default is square)
- Returns:
pydot node
- __pairwise(iterable)
Generate list of pairs from a given list. Used to connect nodes and generate diagram.
- Parameters:
iterable – list of values
- Returns:
list of pairs